

Slow pace explains only part of the Valkyries' defense
Golden State allows 75.2 points a game, 7.8 fewer than any other WNBA team. About 5 of the 12 points below league average come from playing slowly. The other 7 come from efficiency, mostly opponents shooting worse on twos.
By Hoopspire StaffDesk name · September 19, 2026 · 4 min read
The Golden State Valkyries have allowed 75.2 points per game over 41 games. The next-best defense in the WNBA, Washington, allows 83.0. The league average is 87.1.
A gap that size invites a cheap explanation: Golden State plays slowly, so there are fewer possessions and fewer points for everyone. That explanation is partly right. It is also incomplete, and the split between the two halves is the story.
Every figure below is computed from box scores for the 310 regular-season games completed through September 19, 2026 (620 team-games). As a consistency check, the points we rebuilt from each team's field goals, threes and free throws matched the final score in all 620. Golden State's 3,083 points allowed matches the standings.
Part one: the clock
A possession is one team's turn with the ball. We estimate it from the box score as field-goal attempts, minus offensive rebounds, plus turnovers, plus 0.44 of free-throw attempts, then average the two teams' estimates in each game. Defensive rating is points allowed per 100 possessions, which removes the effect of pace.
| Points allowed per game | Possessions per game | Defensive rating | |
|---|---|---|---|
| Golden State | 75.2 | 78.3 | 96.1 |
| Washington (next-best) | 83.0 | 82.1 | 101.0 |
| League average (15 teams) | 87.1 | 83.1 | 104.8 |
Golden State is the slowest team in the league, at 78.3 possessions per game against 82.1 for the next-slowest. The gap to the league average is 11.9 points a game. Splitting it into pace and efficiency gives about 5 points from pace and about 7 from efficiency. The exact split depends on which you adjust first: 4.7 to 5.1 for pace, 6.8 to 7.2 for efficiency. Either way, slow pace accounts for roughly 40% of the gap.
The efficiency part is not marginal. Golden State's defensive rating is 5.0 points per 100 possessions better than Washington's, the next-best. The 15 teams' ratings have a standard deviation (a measure of typical spread) of 3.9, so the Valkyries sit about 1.3 of those from the runner-up.
Part two: where the efficiency comes from
Points per possession can be split into three pieces: how well opponents shoot (effective field-goal percentage, which gives a three-pointer its extra weight), how many shots they get per possession (turnovers and offensive rebounds take shots away), and free throws.
| Opponents against... | Golden State | Washington | League avg |
|---|---|---|---|
| Effective field-goal % | 48.0 | 49.5 | 51.6 |
| Two-point % | 47.3 | 49.1 | 51.8 |
| Three-point % | 32.8 | 33.4 | 34.1 |
| Turnovers per 100 possessions | 18.7 | 15.5 | 16.7 |
| Opponent offensive-rebound % (share of available rebounds) | 24.8 | 21.6 | 25.5 |
| Free-throw attempts per shot | 32.1 | 27.9 | 30.4 |
Of Golden State's 8.7 points per 100 possessions of defensive advantage over the league average:
- Shooting accounts for 5.9. Opponents' effective field-goal percentage is 3.6 points below average.
- Fewer shots per possession accounts for 2.5. Golden State forces the second-most turnovers in the league (18.7 per 100, behind Atlanta's 19.1) and allows a slightly below-average offensive-rebound rate.
- Free throws account for 0.3. Opponents shoot free throws slightly more often per shot than average, but this washes out.
Most of the shooting gap is inside the arc. Opponents make 47.3% of their twos against Golden State, 4.5 points below the league average. On threes the gap is about 1.3 points. Golden State's opponents take slightly more threes than average (38.8% of their shots against 37.1%), so the gap is not explained by opponents taking fewer threes.
What holds up, and how well
It is not a hot streak. Golden State's defensive rating was 98.5 over its first 20 games and 93.7 over the last 21. Both are better than the runner-up's full-season figure of 101.0. In the last five games, all wins, the rating is 84.2, but five games is a small sample and we don't lean on it.
It survives a different possession formula. With free throws weighted at 0.40 instead of 0.44, Golden State's lead over the second-best team is 5.1 points per 100. At 0.475 it is 4.8. It is first in all three.
The offense is ordinary. Golden State scores 105.6 points per 100 possessions, against a league average of 104.8. Its net rating (points scored minus points allowed per 100 possessions) of +9.5 is the best in the league, but Minnesota's is +8.9, and Minnesota has one more win (31-10 against 30-11). Treat those as close to tied.
What the numbers show, and what they don't
The numbers show that Golden State's defense is elite on a per-possession basis and that its pace adds to that in points per game. They show the advantage is concentrated in two-point shooting and, secondarily, in turnovers.
They do not show why opponents shoot worse inside the arc. Box scores carry no shot locations, no measure of how tightly shots were contested, and no rim-protection data. Anything we said about the cause would be a guess. Our reading is that the two-point number is the one to watch, because it is the largest piece of the gap, but the data here can't say what produces it.
The ratings are also not adjusted for opponent strength, and the league average includes Golden State itself. We estimate possessions from box-score totals; box scores do not include possession counts. And we can't tell from box scores whether the slow pace is Golden State's choice or something its defense imposes on opponents, since pace is shared by both teams in a game.
Golden State has three regular-season games left.
Ads are turned off because you declined advertising cookies. You can change that in .
More from The Margin
The WNBA field is set. Almost nothing else is.
Eight teams are locked into the playoffs with games still to play, and three real seeding races, the No. 1 seed included, come down to this week's schedule.
Hoopspire StaffDesk name · Sep 21, 2026 · 3 min read
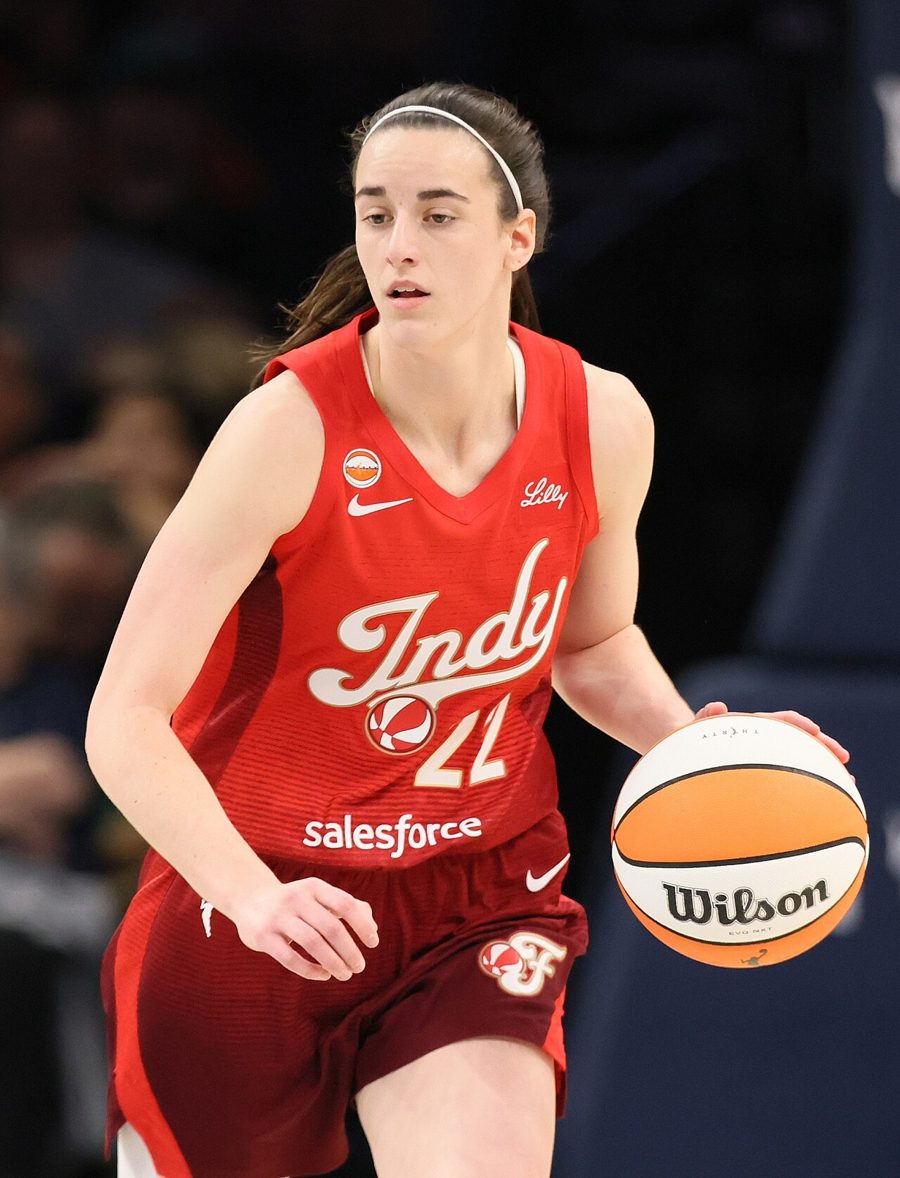
Caitlin Clark leads the WNBA in assists and in turnovers. The Fever still have its best offense.
Clark averages 8.5 assists and 4.6 turnovers a game, first in the league in both. Both come from carrying the second-heaviest possession load in the WNBA, and Indiana's offense is 3.0 points per 100 possessions clear of everyone else.
Hoopspire StaffDesk name · Sep 19, 2026 · 5 min read
Seattle outscored Indiana by 12 from the field and lost by 3
Indiana beat Seattle 110-107 on July 17 with 28 made free throws to Seattle's 13. Caitlin Clark alone attempted more free throws (19) than the Storm did as a team (18), and scored seven of Indiana's last eight points.
Hoopspire StaffDesk name · Sep 19, 2026 · 4 min read