

Caitlin Clark leads the WNBA in assists and in turnovers. The Fever still have its best offense.
Clark averages 8.5 assists and 4.6 turnovers a game, first in the league in both. Both come from carrying the second-heaviest possession load in the WNBA, and Indiana's offense is 3.0 points per 100 possessions clear of everyone else.
By Hoopspire StaffDesk name · September 19, 2026 · 5 min read
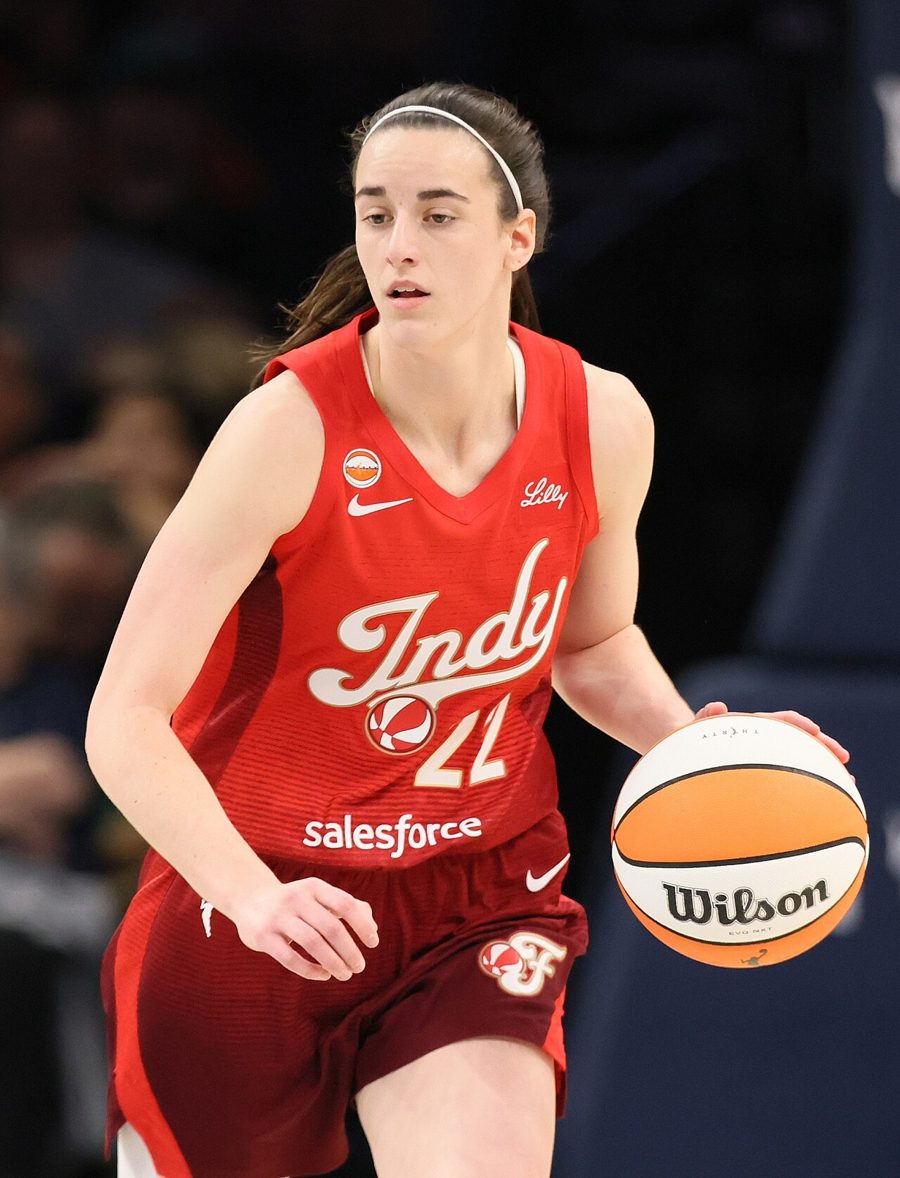
Caitlin Clark averages 8.5 assists per game, the most in the WNBA. She also averages 4.6 turnovers per game, the most in the WNBA. Both figures come from 37 games and rank first among the 124 players who have appeared in at least 30.
A quick read of those two numbers gives two opposite verdicts: she is the league's best creator, and she is its most careless ball handler. The rest of the box score suggests they are the same fact, and that the cost is one the Fever have been able to afford.
Every figure below is computed from box scores for the 310 regular-season games completed through September 19, 2026. Indiana has played 41 of its 44 games. The rest of the schedule: Washington on September 20, then Minnesota twice.
Two league-leading numbers, one workload
Clark's assists lead Alyssa Thomas's 8.4 by only a tenth of an assist, which is too close to call from 37 games. Her turnovers lead the league more clearly (Thomas is second at 3.5).
A player who handles the ball more will turn it over more, so a raw turnover count says little by itself. To put both on the same footing we count possessions used: field-goal attempts, plus 0.44 of free-throw attempts, plus turnovers. It's a standard estimate of how many times a player ended a possession herself. The turnover rate is turnovers divided by possessions used.
| Player | Possessions used per game | Turnover rate | Assists per game |
|---|---|---|---|
| A'ja Wilson | 23.3 | 10.3% | 3.2 |
| Caitlin Clark | 23.2 | 20.0% | 8.5 |
| Kahleah Copper | 21.4 | 11.2% | 1.9 |
| Kelsey Mitchell | 21.1 | 8.1% | 2.8 |
| Marina Mabrey | 20.5 | 15.1% | 3.7 |
Clark uses 23.2 possessions a game, second only to Wilson. The 15 players who use the most possessions, Clark included, turn it over on 12.9% of them, pooled. Clark's rate is 20.0%.
She is not alone in that rate among the league's passers. Thomas is at 21.7% and Chelsea Gray at 20.5%, but they use 16.3 and 13.5 possessions a game. Jackie Young (13.4%) and Paige Bueckers (11.5%) pass a lot and turn it over far less. What is unusual about Clark is the combination: the passing load of the league's top passers on the possession load of a lead scorer.
What it costs
Indiana scores 113.2 points per 100 possessions, the best rate in the league. Minnesota and Las Vegas are next at 110.2, and the league average is 104.8. Possessions here are box-score estimates, as above.
Indiana's team turnover rate is 16.7 per 100 possessions. The league average across the 15 teams is also 16.7. So the turnovers Clark accumulates are not producing an offense that gives the ball away more than a typical one.
We can't say why from these numbers. It may be that her turnovers are the price of passes that also create shots for a very good offense, or that teammates turn it over less. Box scores don't separate the two, and we don't claim to.
The season got better as it went
| First 18 games (May 9 to July 9) | Last 19 games (July 13 to Sept. 18) | |
|---|---|---|
| Points per game | 20.5 | 24.6 |
| Assists per game | 7.9 | 9.2 |
| Turnovers per game | 4.6 | 4.7 |
| Minutes per game | 30.0 | 32.6 |
| Field-goal % | 42.6 (118 of 277) | 48.4 (148 of 306) |
| Three-point % | 33.6 (45 of 134) | 39.9 (63 of 158) |
| Free-throw attempts per game | 5.7 | 6.9 |
| True shooting % | 57.2 | 64.3 |
| Fever record in her games | 9-9 | 14-5 |
True shooting percentage is points divided by twice the shots she takes, counting free throws (field-goal attempts plus 0.44 of free-throw attempts). It gives credit for threes and free throws that plain field-goal percentage does not. Her season figure is 61.0%. The league's qualifying players, pooled, shoot 56.4%.
The gains are real in the box score, but the shooting part may not last. On 134 and 158 three-point attempts, a difference of about six points in three-point percentage is within what luck alone produces. The field-goal difference (about six points as well) is closer to meaningful but still inside the range of chance. What did change more clearly is volume: more minutes, more three-point attempts, more free throws, more assists. Her turnovers did not move.
Her six 30-point games are all in the record, and the Fever won five of them. The biggest was 45 points against Seattle on July 17, on 11-of-18 shooting with six threes and 17 of 19 from the line, in 29 minutes. Indiana won 110-107. Two more came in late August: 37 at Chicago on August 23 and 34 against Connecticut on August 28, when the Fever outscored the Sun by 32 points while she was on the floor.
The four games she wasn't in
The box scores show no minutes for Clark in four Indiana games: three listed with no minutes played and one where she does not appear in the box score at all. We don't know why, and we won't guess.
The Fever won all four, by an average of 15.0 points. With her, they are 23-14 with an average margin of 5.4.
That is four games. Three of them came against teams now below .500 (Portland 16-26, Los Angeles 15-26, Phoenix 15-27) and one against Las Vegas (28-14). It would be a mistake to read anything about her value into a 4-0 record over four games, in either direction, and we don't.
What the numbers show, and what they don't
The numbers show that Clark's assist and turnover totals are both league-best, that they sit on the second-largest possession load in the league, and that Indiana's offense is the league's best with an ordinary turnover rate.
They do not show whether her passing is why the offense is good. Assists depend on teammates making shots, and box scores carry no tracking data, no shot quality and no split of live-ball and dead-ball turnovers. The improvement between the two halves of her season is clearest in workload and free throws, and least clear in shooting percentage, where the sample sizes are too small to separate skill from luck.
Rankings here are among the 124 players with at least 30 games played; a different cutoff would change who appears in the top five. The league's qualifying-player figures for true shooting and turnover rate are pooled totals, not averages of player averages. Possession counts are not published, so possessions used and team ratings are estimates from box-score totals.
Ads are turned off because you declined advertising cookies. You can change that in .
More from The Margin
The WNBA field is set. Almost nothing else is.
Eight teams are locked into the playoffs with games still to play, and three real seeding races, the No. 1 seed included, come down to this week's schedule.
Hoopspire StaffDesk name · Sep 21, 2026 · 3 min read
Seattle outscored Indiana by 12 from the field and lost by 3
Indiana beat Seattle 110-107 on July 17 with 28 made free throws to Seattle's 13. Caitlin Clark alone attempted more free throws (19) than the Storm did as a team (18), and scored seven of Indiana's last eight points.
Hoopspire StaffDesk name · Sep 19, 2026 · 4 min read
Slow pace explains only part of the Valkyries' defense
Golden State allows 75.2 points a game, 7.8 fewer than any other WNBA team. About 5 of the 12 points below league average come from playing slowly. The other 7 come from efficiency, mostly opponents shooting worse on twos.
Hoopspire StaffDesk name · Sep 19, 2026 · 4 min read